
Reports ✨
Generate custom reports by date, based on specific metrics. Gain insights into trends over time, measure efficiency, and quickly prove the value and impact of your research. Easily create, view, export, and share powerful reports based on your study, participant, and panel data.
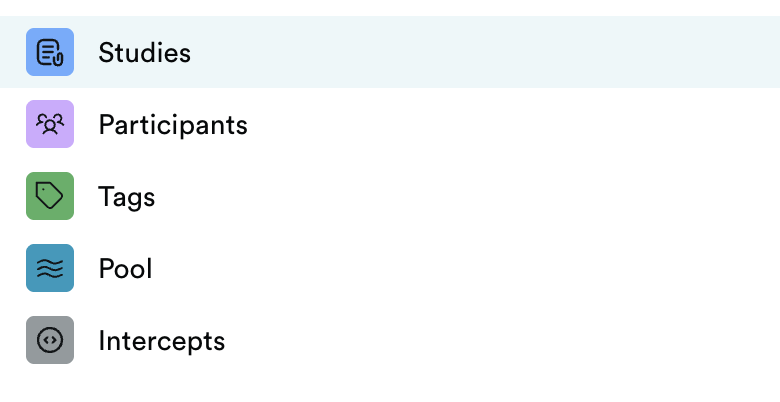
- Study Report: generate insights based on study details like study type, start date, and end date to track and analyze project timelines and activities.
- Participant Report: breakdown of participant level metrics to see how individual engagement changes over time, like Q1, Q2, or Year to Date.
- Tag Report: how tags used in Pool (panel engagement) change over time
- Pool Report: metrics for your Pool segments over time, like participants added and email distribution stats (invites sent, delivered, opened, and clicked).
- Intercept Report: metrics for your web intercepts over time, like study views, where the code is running (JS ID, detected domain, placement indicator), and number of days with live code.
Report attributes
Depending on the report type, you can use the following attributes to customize your report, and they default to "all" or you can narrow things down:
- Studies - select individual studies
- Date range - generally by date created is the preferred method or by activity for when each metric occurred
- Facilitation - moderated, unmoderated, or hybrid
- Metrics - select individual metrics

Year in review
In December, you should see a summary of your Ethnio activity with one or more of the metrics below. You can find an explanation of these metrics in our year-end blog post here.
